
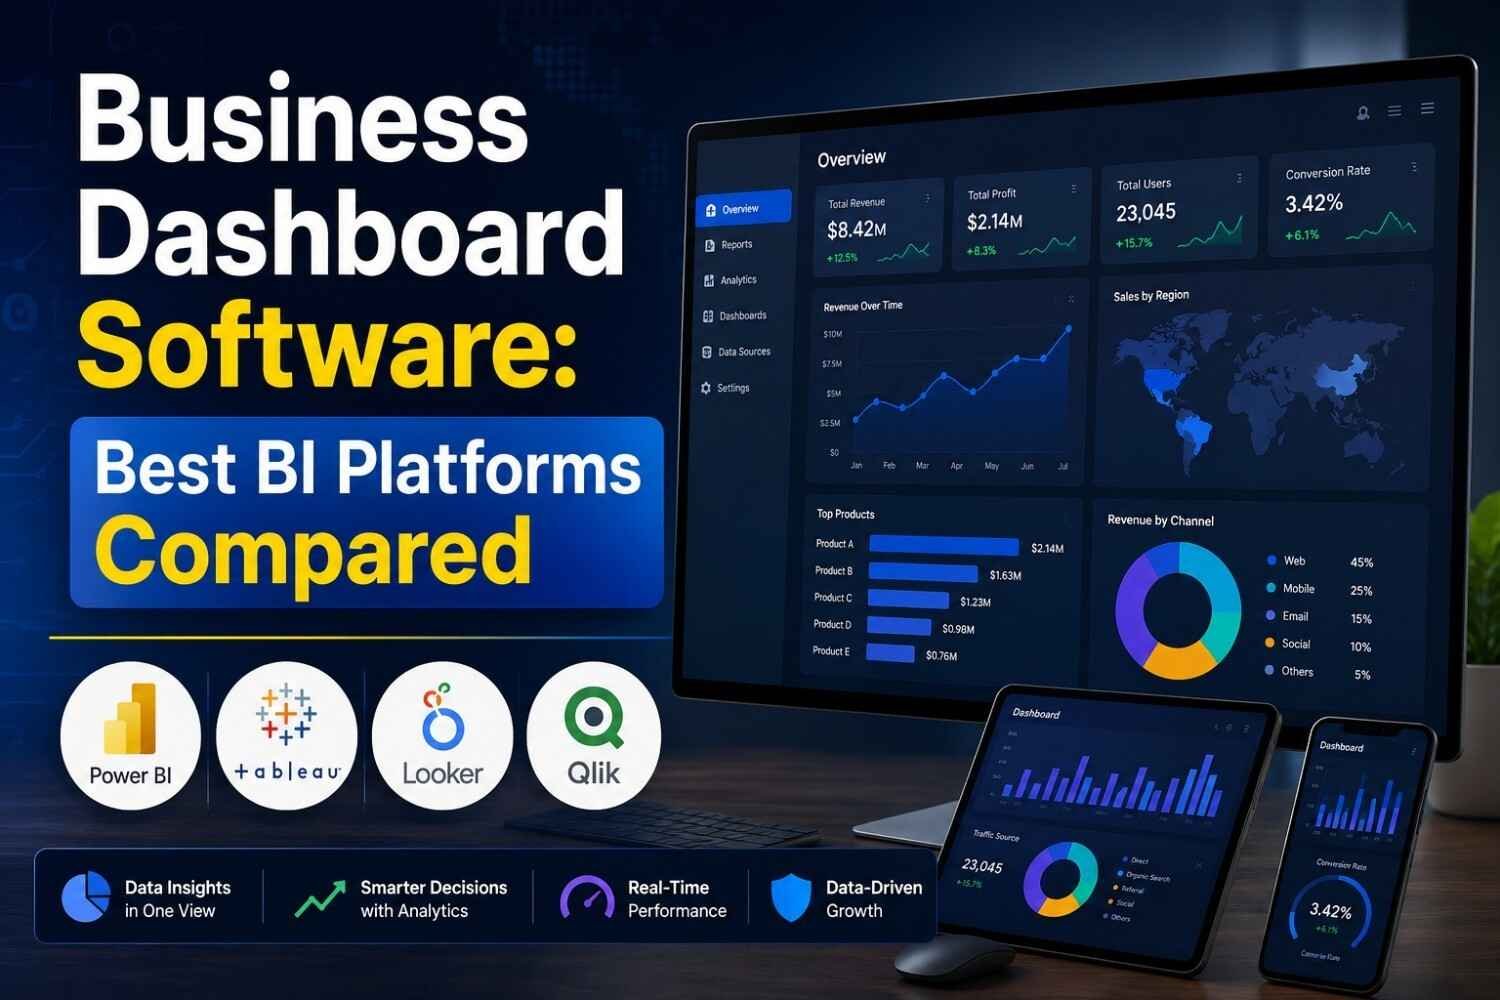
In today's competitive business landscape, making decisions based on accurate data is no longer optional. Organizations generate massive amounts of information from sales, finance, marketing, customer service, HR, and operations every day. Without the right tools, this data becomes difficult to understand and nearly impossible to use effectively.
This is where Business Dashboard Software becomes essential.
Modern Business Intelligence (BI) platforms transform complex business data into easy-to-read dashboards, interactive reports, and actionable insights. Whether you're a startup, SME, or global enterprise, the right BI solution helps improve decision-making, increase productivity, reduce operational costs, and uncover new growth opportunities.
What is Business Dashboard Software?
Business Dashboard Software is a visualization platform that collects business data from multiple sources and displays it in interactive dashboards.
Instead of manually reviewing spreadsheets, businesses can monitor revenue, sales performance, marketing ROI, customer growth, financial KPIs, employee productivity, inventory, supply chain, website analytics, and operational metrics—all in one centralized dashboard.
Why Businesses Need BI Dashboard Software
Organizations invest in Business Intelligence Software because it provides real-time reporting, AI-powered analytics, better forecasting, data-driven decisions, executive dashboards, automated reporting, KPI tracking, department collaboration, performance monitoring, and faster decision making.
Key Features to Look For
1. Interactive Dashboards
Drag-and-drop dashboard builder with charts, maps, gauges, scorecards, and graphs.
2. AI-Powered Analytics
Modern BI tools provide AI insights, predictive analytics, trend forecasting, natural language queries, and automated recommendations.
3. Real-Time Data Integration
Connect data from CRM, ERP, accounting software, SQL databases, Excel, Google Analytics, cloud applications, and marketing platforms.
4. KPI Monitoring
Track important business metrics including revenue, profit, expenses, sales conversion, customer acquisition, churn rate, and marketing performance.
5. Mobile Dashboard
Executives can monitor business performance from smartphones and tablets.
Best Business Dashboard Software Compared
1. Microsoft Power BI
Best for large enterprises already using Microsoft products. Features include AI analytics, hundreds of integrations, interactive reports, Excel integration, Power Query, and machine learning support. Pros: Affordable, enterprise-grade, excellent visualization. Cons: Learning curve.
2. Tableau
Best for advanced data visualization. Features include interactive dashboards, drag-and-drop analytics, predictive analysis, AI insights, and storytelling dashboards. Pros: Beautiful reports, enterprise scalability, powerful analytics. Cons: Premium pricing.
3. Looker
Best for Google Cloud businesses. Features include cloud-native BI, embedded analytics, SQL modeling, AI dashboards, and real-time reporting.
4. Qlik Sense
Best for associative data analysis. Features include smart search, AI recommendations, self-service analytics, and interactive dashboards.
5. Sisense
Best for embedded analytics. Features include AI insights, API integration, white-label dashboards, and scalable analytics.
6. Zoho Analytics
Best for small and medium businesses. Features include affordable pricing, AI assistant, dashboard builder, and automated reports.
7. Domo
Best for enterprise reporting. Features include real-time dashboards, mobile BI, cloud analytics, and AI automation.
8. SAP Analytics Cloud
Best for large enterprises. Features include financial planning, predictive analytics, enterprise dashboards, and AI forecasting.
Comparison Table
| Platform | AI Analytics | Cloud | Real-Time | Best For |
|---|---|---|---|---|
| Power BI | ✅ | ✅ | ✅ | Enterprises |
| Tableau | ✅ | ✅ | ✅ | Visualization |
| Looker | ✅ | ✅ | ✅ | Google Cloud |
| Qlik Sense | ✅ | ✅ | ✅ | Data Discovery |
| Sisense | ✅ | ✅ | ✅ | Embedded BI |
| Zoho Analytics | ✅ | ✅ | ✅ | SMB |
| Domo | ✅ | ✅ | ✅ | Enterprise |
| SAP Analytics Cloud | ✅ | ✅ | ✅ | Large Organizations |
Benefits of Business Dashboard Software
- Faster reporting
- Better executive decisions
- Higher employee productivity
- Reduced manual reporting
- Increased revenue visibility
- Improved customer insights
- Better financial planning
- Lower operational costs
- Enhanced forecasting
- Stronger business growth
How to Choose the Right BI Platform
Before purchasing, consider budget, integration with CRM, ERP, accounting and cloud applications, scalability, AI features, security, and customer support.
Future Trends (2026)
- AI Copilots
- Conversational Analytics
- Natural Language Reporting
- Predictive Intelligence
- Automated KPI Alerts
- Embedded BI
- Generative AI Dashboards
- No-Code Dashboard Builders
- Multi-Cloud Analytics
- Real-Time Streaming Dashboards
Frequently Asked Questions
What is Business Dashboard Software?
Business Dashboard Software is a platform that visualizes business data through interactive dashboards, enabling organizations to monitor KPIs and make data-driven decisions.
Which BI platform is best?
Microsoft Power BI, Tableau, Looker, and Qlik Sense are among the top choices, with the best option depending on your budget, technical expertise, and business requirements.
Is BI software suitable for small businesses?
Yes. Solutions like Zoho Analytics and Microsoft Power BI offer affordable plans and features designed for startups and SMEs.
Final Thoughts
Business Dashboard Software has become a strategic asset for organizations seeking to transform raw data into meaningful business intelligence. Whether your goal is tracking KPIs, improving operational efficiency, forecasting revenue, or enabling executive decision-making, selecting the right BI platform can provide a significant competitive advantage.
For startups and SMBs, Zoho Analytics offers an affordable and user-friendly solution. Mid-sized organizations often find Microsoft Power BI to deliver exceptional value through its extensive integrations and AI capabilities. Enterprises with complex data visualization needs may prefer Tableau, while organizations deeply invested in the Google ecosystem can benefit from Looker. Businesses requiring embedded analytics should consider Sisense, and those focused on advanced associative analytics may find Qlik Sense the best fit.
As AI continues to reshape business intelligence, investing in a modern BI platform today positions your organization for smarter decisions, faster reporting, and sustained growth in the years ahead.